Sales leaders require accurate and credible data that will help them gauge whether their teams are on track to meeting their revenue goals. In this respect, while HubSpot offers various ready-made options for sales reporting, larger sales organizations might require more detailed information about the state of pipelines, sales processes, sales reps' efficiency, and forecasting. In such scenarios, it becomes useful to use custom HubSpot reports and dashboards. With the help of custom HubSpot dashboards, it is possible to put all of the required sales metrics in one place and analyze pipeline gaps, sales performance, and make evidence-based decisions. Moreover, HubSpot custom reports and dashboards are flexible enough to tailor to any specific needs of the organization in terms of its sales process, sales team, and particular business goal.
What Are HubSpot Custom Reports and Dashboards?
A HubSpot custom report is a unique type of report that enables sales representatives to examine CRM data depending on their particular business requirements. Apart from predefined reports, sales managers have the opportunity to pick appropriate data, apply filters, compare certain metrics, and analyze trends within deals, contacts, companies, sales activities, and other types of CRM records.
In addition to that, a HubSpot dashboard is an accumulation of various reports into one place, thus enabling sales managers to monitor critical metrics related to their sales performance and changes in it. For instance, a sales manager can build a dashboard with such metrics as pipeline value, deal win rate, sales cycle duration, quota achievement, and sales forecast.
The main difference between these two concepts is that while a report offers analysis of certain data, a dashboard gives an overview of various performance indicators.
Why Sales Leaders Need Custom Reporting in HubSpot
The sales team leader needs more than simple CRM metrics to know what drives sales performance. The use of HubSpot custom reporting provides the means to generate valuable insights into the value of the sales pipeline, the stage at which deals are at, the performance of reps, conversion rates, and revenues, depending on individual business requirements.
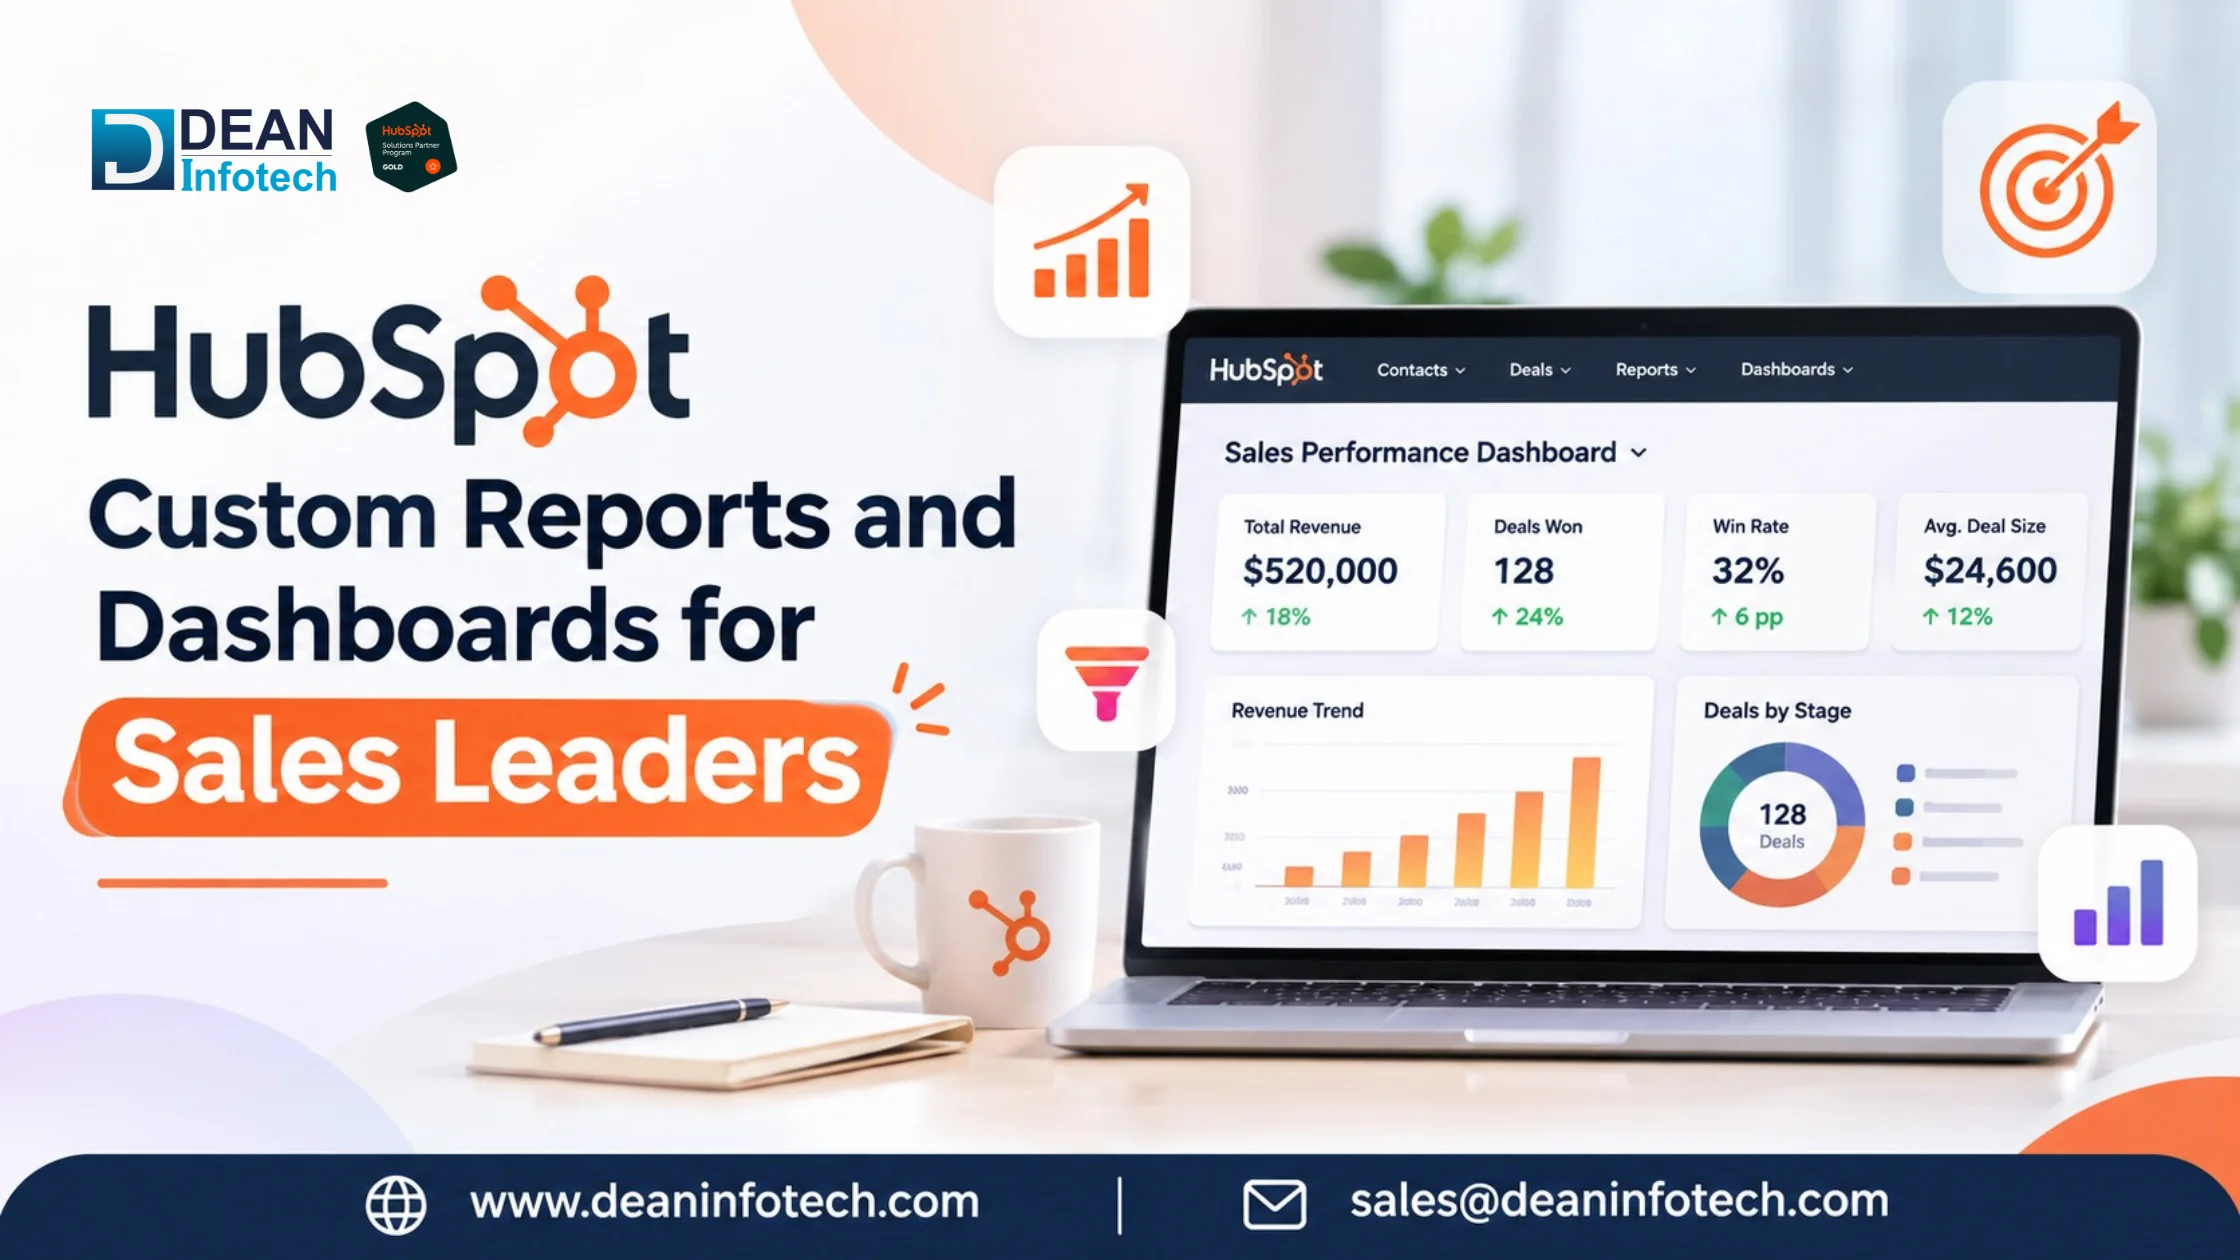
Standard reports might do fine for some simple monitoring, but the increasingly large sales teams usually require custom HubSpot reporting to find answers to more specific questions. These include such concerns as which sales stages cause the most problems for the company, which sales reps have the most chances to meet their quotas, and why certain deals are being lost.
All these insights can be easily gathered in one place with the help of the HubSpot sales dashboards. This way, the sales leader will have access to all the information needed in order to compare performance to goals, identify potential problems, and focus on priority tasks.
Which Sales Metrics Should Your HubSpot Dashboard Track?
An effective sales dashboard from HubSpot needs to be concentrated on the metrics that can help sales managers gauge performance and mitigate risks. Too many metrics can confuse a user, so choose those KPIs that link sales efforts with the results.
| Sales Metric | What It Helps Measure |
| Pipeline Value | Total potential revenue in the sales pipeline |
| Weighted Pipeline | Expected revenue based on deal probability |
| Win Rate | Percentage of opportunities converted into customers |
| Average Deal Size | Average revenue generated from closed deals |
| Sales Cycle Length | Average time required to close opportunities |
| Deal Velocity | How quickly opportunities move through the pipeline |
| Quota Attainment | Progress toward individual or team sales targets |
| Stage Conversion Rate | Effectiveness of moving deals between pipeline stages |
| Forecast vs. Actual Revenue | Accuracy of sales forecasts |
| Sales Activity | Calls, emails, meetings, and follow-ups completed |
With these sales metrics provided by HubSpot, management has an overview of the condition of the sales pipeline, productivity, and revenue. The purpose of such analysis is not only to collect information but also to analyze the trends and discover bottlenecks using custom HubSpot reports and dashboards.
7 Custom HubSpot Reports Every Sales Leader Should Have
The reporting needs of sales executives require more than just simple activity reports. Properly configured HubSpot custom reports will give you insights into where the money comes from, where deals are getting stuck, and where help is needed. Here are seven such reports to build your sales dashboard on.
1. Pipeline by Stage of Deal
A pipeline report allows you to see the total value of possible revenue for each stage of the deal process. Sales management will know instantly how the pipeline is going, where opportunities are building up, and where bottlenecks can emerge.
2. Sales Forecast & Quota Achievement
The comparison of expected revenue and sales targets is done through this report. By monitoring sales forecast & quota achievement, management will learn whether individuals and the team as a whole are meeting their objectives or not.
3. Sales Rep Performance
A report of sales rep performance will allow you to track wins, revenue, conversion, pipeline, and sales activity. Comparison of such metrics will help you find top performers and those reps who require training.
4. Deal Velocity & Sales Cycle
An understanding of deal velocity is necessary for successful planning. This report gives insight into how long the sales cycle is and the process of moving deals through the pipeline, assisting the sales leader in identifying issues within the pipeline.
5. Win/Loss Analysis
Win/loss analysis gives information about why opportunities were won or lost. The sales leader may choose to look at loss reasons, deal sizes, industries, sales rep involved, or any other factor that will help him identify patterns in his sales.
6. Lead-to-Customer Conversions
This report shows how prospects move from a lead through opportunity creation and all the way through to closing the deal as a customer. The report can help the sales leader figure out where the holes are in the conversion process and what lead sources perform the best.
7. Sales Activities and Revenue
It is much more meaningful to analyze activity data in context of how it impacts revenues. This report contrasts calls, emails, meetings and follow-up activities with the opportunities that were generated or deals closed.
Combined, these sales reports from HubSpot provide business leaders with a broader understanding of pipeline, team, sales, and revenue metrics. Rather than looking at individual metrics, business leaders can utilize custom-made dashboards from HubSpot that aggregate all of this information.
How to Build a Custom Sales Dashboard in HubSpot
Creating a good HubSpot sales dashboard involves identifying the sales questions that you hope your dashboard will solve. Rather than tackling all the possibilities, focus on metrics such as pipeline revenue, forecasting accuracy, win rate, quota attainment, and sales cycle time.
Step 1: Decide What You Want to Measure
Learn what is there in the process of sales managers that they want to measure: is it the sales pipeline, sales representative's activities, forecasting of revenue, or the closing rate of deals?
Step 2: Select Relevant Data Sources
Select the data sources from HubSpot which will be used for your analysis: Deals, Contacts, Companies, Activities, Owners, Custom CRM Properties. It is possible to integrate various data sources with the help of HubSpot custom report builder.
Step 3: Create Custom Reports
Choose the type of report that is suitable, fill in the necessary information, use filters, choose a visualization technique, and save all created reports on your dashboard.
Step 4: Arrange Your Dashboard Properly
The statistics which are the most critical with respect to revenue generation and pipeline management must appear first. Do not add any unnecessary data.
Step 5: Analyze and Optimize
Check regularly if your dashboard corresponds to current sales goals. The HubSpot services from Dean Infotech company may help businesses create and customize sales reporting and dashboards according to their CRM and revenue needs.
Custom Reports vs. Standard HubSpot Reports: Which Should You Use?
Choice of either one of the HubSpot report templates depends upon the level of complication in the sales process and the level of analysis needed by the team. Both templates have equal importance but have different applications.
The usual HubSpot reports are templates made to fulfill the needs of the ordinary sales and CRM requirements. They are quicker to implement and can aid teams in analyzing simple metrics such as number of deals, value of the pipeline, sales activity, and revenue performance. Standard reports will be sufficient for companies having simple reporting needs.
The HubSpot custom reports are ideal for companies which require more detailed analytics. The sales leaders can customize the data source, filters, properties, calculations, and visualization to ask questions that cannot be asked via the standard reports. For instance, the company might need a comparison of its sales performance based on various aspects such as geography, product, type of deal, or customers.
| Standard HubSpot Reports | Custom HubSpot Reports |
| Pre-built and quick to configure | Designed around specific business needs |
| Suitable for common KPIs | Suitable for complex analysis |
| Less customization | Greater flexibility |
| Useful for basic sales tracking | Better for advanced sales reporting |
| Faster implementation | Requires more planning and configuration |
A perfect solution does not always lie in either of the two. Many sales teams rely on built-in HubSpot reporting features for routine reporting and go for customized reports and dashboards when deeper investigation is required. This way they ensure effective daily reporting while retaining the flexibility to dig deep into pipeline, performance, forecasting, and revenue.
When Should You Consider Professional HubSpot Reporting Services?
If your sales force is taking a lot of time in manual report creation, finding themselves confused about inaccurate dashboards, or requiring reporting that goes further than the built-in capabilities of HubSpot, professional assistance is here to help you. HubSpot Reporting Services are especially helpful when you require assistance due to having many pipelines, sophisticated sales processes, custom properties or sophisticated key performance indicators. A professional will be able to provide customized HubSpot reporting, sales dashboards, pipeline reports and revenue reporting based on your company’s needs. Dean Infotech offers HubSpot consulting services, HubSpot Managed Services, reporting and dashboard customization and overall portal optimization.
Conclusion
Good sales leadership needs good information and visibility into performance. Custom HubSpot reports and HubSpot dashboards enable sales leaders to keep track of pipeline health, performance of the sales team, sales cycle velocity, forecasting, conversion rate, and revenues all from one place. If regular reports do not meet your needs, then you can always resort to customized HubSpot reports. You may also consider taking advantage of HubSpot reporting and hubspot consultancy services for building and maintaining dashboards. The right reporting strategy makes HubSpot not only a CRM but also a powerful sales analytics and revenue management tool.
Need expert help with your next project?
Get expert guidance across Salesforce, HubSpot, GoHighLevel (GHL), AI, and web development — tailored to your business.







Comments