Sales managers need not only a customer relationship management system with the database of customers and deals but also some insights which can help them to make an informed decision. In addition, with the use of HubSpot CRM Analytics , sales representatives are able to find insights into their CRM data based on such criteria as pipeline health, conversion rate, deal efficiency, sales activity, and revenue growth.
The application of the right sales key performance indicators within the HubSpot system helps sales managers to identify problems, understand at what stage the prospects drop off, assess the effectiveness of their team, and predict sales results. Instead of guesswork or manual work with spreadsheets, they can use the tools of HubSpot for monitoring important metrics.
Fast-growing companies need CRM analytics to be able to spot problems before they happen and predict sales and revenue.
What Is HubSpot CRM Analytics?
The HubSpot CRM Analytics is a procedure that involves measuring sales performance, discovering trends, and making decisions based on CRM data analysis. While CRM data is simply the data stored by the CRM system, reporting is the organization of the data into measurable reports while analytics is the analysis of these results to discover insights and opportunities.
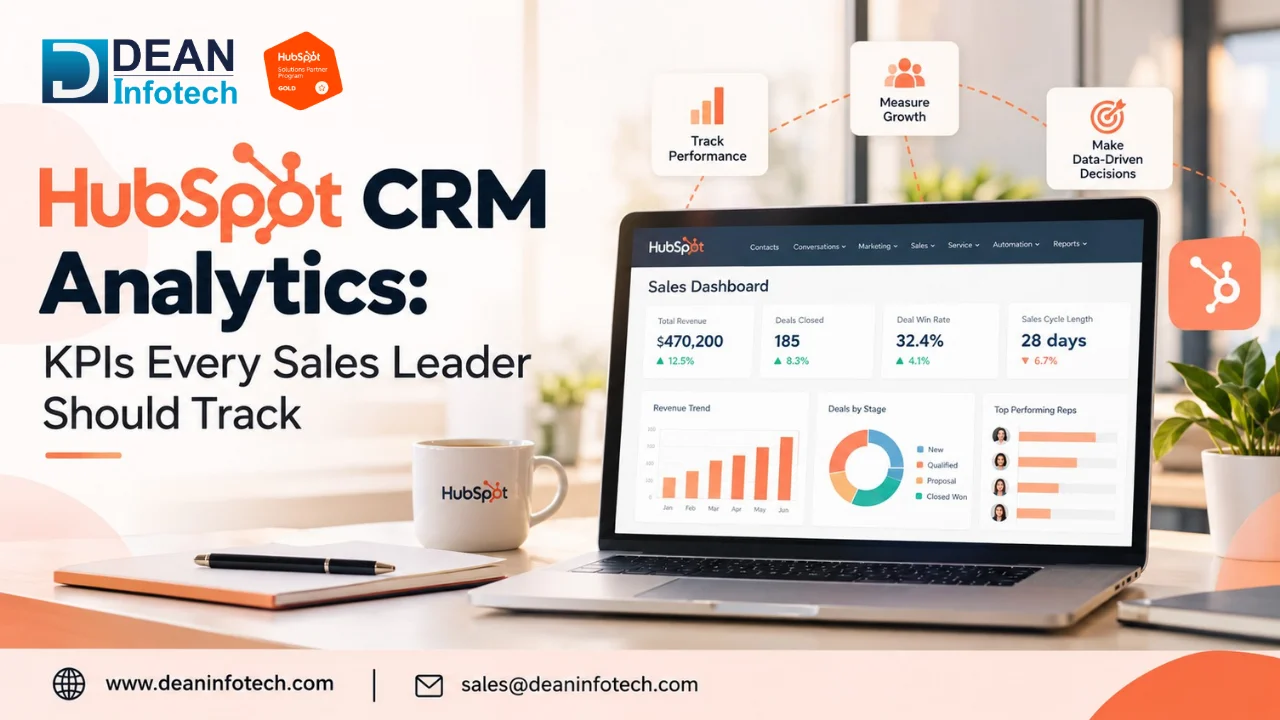
Sales Analytics provided by HubSpot comes in ready-made reports which can be customized and included in dashboards to allow sales leaders to monitor sales team performance and pipeline management. Dashboards help visualize metrics by collecting them and presenting sales activities, deals, conversions, and revenues at one place. With the connection of individual KPIs such as win rate, pipeline, and sales velocity to the revenue goal, sales leaders will discover areas for improvement and opportunities for forecasting and decision-making.
10 Essential HubSpot CRM KPIs Every Sales Leader Should Track
The strength of using HubSpot CRM analysis is knowing what numbers really matter for revenues. In a sales dashboard, there may be many metrics to watch, but not all of these must receive the same amount of attention from sales managers. The key performance indicators listed below show how to understand the state of sales pipeline, effectiveness of the sales process, and revenue opportunities.
1. Sales Pipeline Value
The sales pipeline value demonstrates the possible revenue represented by your existing open deals. It is useful to analyze the whole pipeline and its value at each stage of sales to get an understanding of how much business you have and where it is situated.
Another useful thing to do is to analyze both weighted and unweighted pipelines. The unweighted pipeline will show you the overall value of all deals that you have. The weighted pipeline takes into account the chances that deals will close.
Why it matters: The fact is that having a large sales pipeline doesn’t necessarily mean that you have a good sales pipeline.
2. Pipeline Coverage Ratio
Having a revenue goal is just one part of the picture. Another thing that sales leaders must have an understanding about is whether the pipeline that the team is working with contains sufficient deals that qualify. The metric used for evaluating this is known as the pipeline coverage ratio, which evaluates the total value of qualified deals in relation to the sales target.
Pipeline Coverage = Total Value of Qualified Pipeline ÷ Sales Target
For instance, if the pipeline value of the team is $1 million when the target is $250,000, then the pipeline coverage ratio would be 4×. But how much coverage is needed is relative to many other variables such as past win rates, deal size, and sales cycle time.
3. Deal Win Rate
Deal win rate gives an insight into how efficient the sales team is in turning prospects into customers. Rather than just focusing on closed deals, one can use the KPI to gauge how many times the qualified leads turn out to be winning deals.
Win Rate = Closed-Won Deals ÷ (Closed-Won + Closed-Lost Deals) × 100
Measure the win rate through various time intervals, individual sales reps, industry, deal size, and sales stages. A sudden drop in win rate may be indicative of any changes in the quality of leads, competition, prices, sales process, or customer demand.
4. Sales Conversion Rate
An opportunity can get into your sales pipeline and never qualify to become an opportunity or customer at all. This is what sales conversion rate can pinpoint.
By calculating lead to opportunity, opportunity to customer, and stage to stage conversion rate, management will be able to see exactly where prospects go missing. If there is a high number of opportunities getting to the proposal stage but few making it past, the problem might lie in pricing, positioning, follow-ups, or sales process.
Comparison of conversion rates between reps and among segments and periods can shed light on areas that are invisible when analyzing revenues alone.
5. Average Deal Size
Average deal size represents the average revenue of closed won deals. This helps in gauging if the company is growing because of more customers or larger deals or both.
Average Deal Size = Total Revenue of Closed Won Deals / Number of Closed Won Deals
Monitor the average deal size over time and do an analysis depending on different types of products, industries, geographical areas, and salespersons. The rising trend of average deal size implies that there is still some room for improvement in qualification, upselling, and target market selection.
6. Sales Cycle Length
The sales cycle time is the amount of time that the deals take to be completed from the beginning to closing. This KPI helps us understand our sales process well and allows us to identify slow deals.
Look at the sales cycle time of various sales teams, products, customer groups, and pipeline stages. Long sales cycle times can affect the capacity of sales people and the forecast. If you see that deals lag at one particular stage, it could be a sign of a problem with your sales process.
7. Sales Velocity
Sales velocity is the measurement of how fast revenue opportunities are flowing in the pipeline. This metric involves opportunities, win rate, average deal value, and sales cycle duration.
Sales Velocity = Opportunities x Win Rate x Average Deal Value ÷ Sales Cycle Duration
It’s not just about generating opportunities alone; a well-oiled sales machine will do more than that. The sales process should also have a way of converting opportunities into revenue effectively. Keeping track of the sales velocity can help managers see if any modifications to qualifying opportunities and sales operations have worked.
Best Practices for Implementing KPIs
Selecting appropriate KPIs may be considered the initial step to take. For getting relevant output based on the analysis using HubSpot CRM, the sales team requires a systematic approach towards monitoring their performance metrics.
1. Start with the business objective: Highlight areas which need improvement like sales revenues, pipeline generation, conversion or reaching a target, then select KPIs that will be linked with these objectives.
2. Benchmarking: Benchmark your KPIs against previous performance, sales objectives, or industry norms. For instance, determine your pipeline coverage ratio or win rates.
3. Create Hubspot properties: Make sure you get deal stage, closing date, deal size, lead source, or any other CRM property captured every time.
4. Customization of dashboards: Create customized dashboards for your executives, managers, and sales reps. These dashboards should capture the KPIs needed for each audience.
5. Tracking of KPIs: Capture your leading indicators every week and your revenue-related KPIs every month or quarter. It’s better to track trends than metrics.
6. Taking actions: Allocate owners and actions for each under-targeted KPI. Make use of KPIs insights to train your sales reps, fill your pipeline, improve processes, and more.
7. Evolve: From time to time check the KPIs used for making decisions and remove all irrelevant KPIs that only add noise.
Common Pitfalls in KPI Tracking and How to Avoid Them
Measuring KPIs using HubSpot will enhance visibility of sales, but badly handled metrics may result in flawed conclusions. Some ways that can be applied to ensure the mistakes are not made include:
1. Monitoring unnecessary KPIs: You should always ensure that you focus on those KPIs that have a direct connection with your revenues and sales objectives. Start with the first KPIs and then only add more where there is a need for better decision-making.
2. Measuring activity instead of results: You should not measure your representatives by looking at the number of calls, emails and face-to-face contacts they make. The activities should rather be measured in terms of opportunities generated, win rates and revenues made.
3. Neglecting CRM data integrity: Define the required fields and deal stages as well as the data entry requirements. Perform periodic reviews of the CRM to see what data is missing or redundant.
4. Siloed evaluation of metrics: Review all the associated KPIs. For instance, low revenues in conjunction with proper pipeline coverage mean that timing is a problem, but low revenues along with pipeline indicate sales problems.
5. Not doing anything with insights: Establish certain thresholds and assign people responsible for the follow-ups. Whenever any KPI falls behind the target level, note down why it happened, determine the corrective action and look at the outcome during the next review period.
6. Applying outdated benchmarks: Update your targets as you go because markets, offerings, sales cycles, and teams
Conclusion
Incorporating HubSpot CRM Analytics makes sales executives transition from simply storing customer information to informed and revenue-driven decision-making. Tracking KPIs like pipeline value, win rate, conversion rate, sales velocity, and attainment of quotas help to detect bottlenecks in the sales process, enhance forecasting, and take action against any pipeline threats before it’s too late.
It’s important to track not all available metrics, but only those that directly relate to your business objectives in the context of HubSpot CRM KPIs. This will enable your sales team to take actionable steps based on the provided information, thanks to proper data, dashboards, reviews, and action plans.
Dean Infotech assists companies in optimizing their use of HubSpot CRM through analytics and reporting in order for sales executives to have better visibility and performance in sales.
Need expert help with your next project?
Get expert guidance across Salesforce, HubSpot, GoHighLevel (GHL), AI, and web development — tailored to your business.








Comments